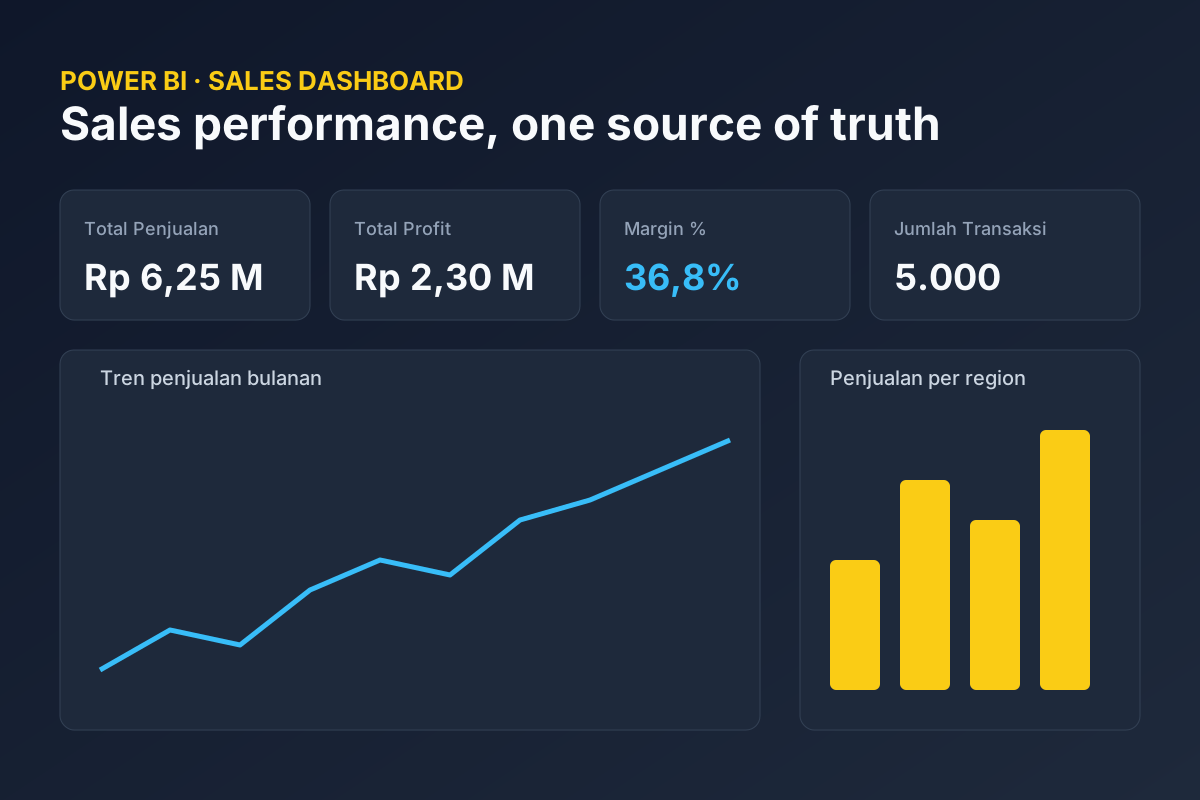
Sales performance dashboard in Power BI.
One semantic model, nine DAX measures and one page in Power BI.
What does the work involve?
Portfolio project. All data is fictional and simulated.
A sales performance dashboard built in Power BI: one semantic model, nine DAX measures and one page covering sales, profit, margin and the monthly trend, with region and category breakdowns.
It is saved as a PBIP (Power BI Project), so the model and the report are plain text and can live in Git. Download the project files and open SalesDashboard.pbip in Power BI Desktop.