HR & MIS KPI Dashboard (Web)
A trend across 12 months, with the recap scheduled to email and WhatsApp at 08:00.
What does the work involve?
Portfolio project. The demo data is fictional and simulated.
HR reports turnover and training hours. MIS reports SLA and budget. Two decks, one month, two answers, and a monthly recap rebuilt by hand. So I built one dashboard where both audiences read from the same model.
The model
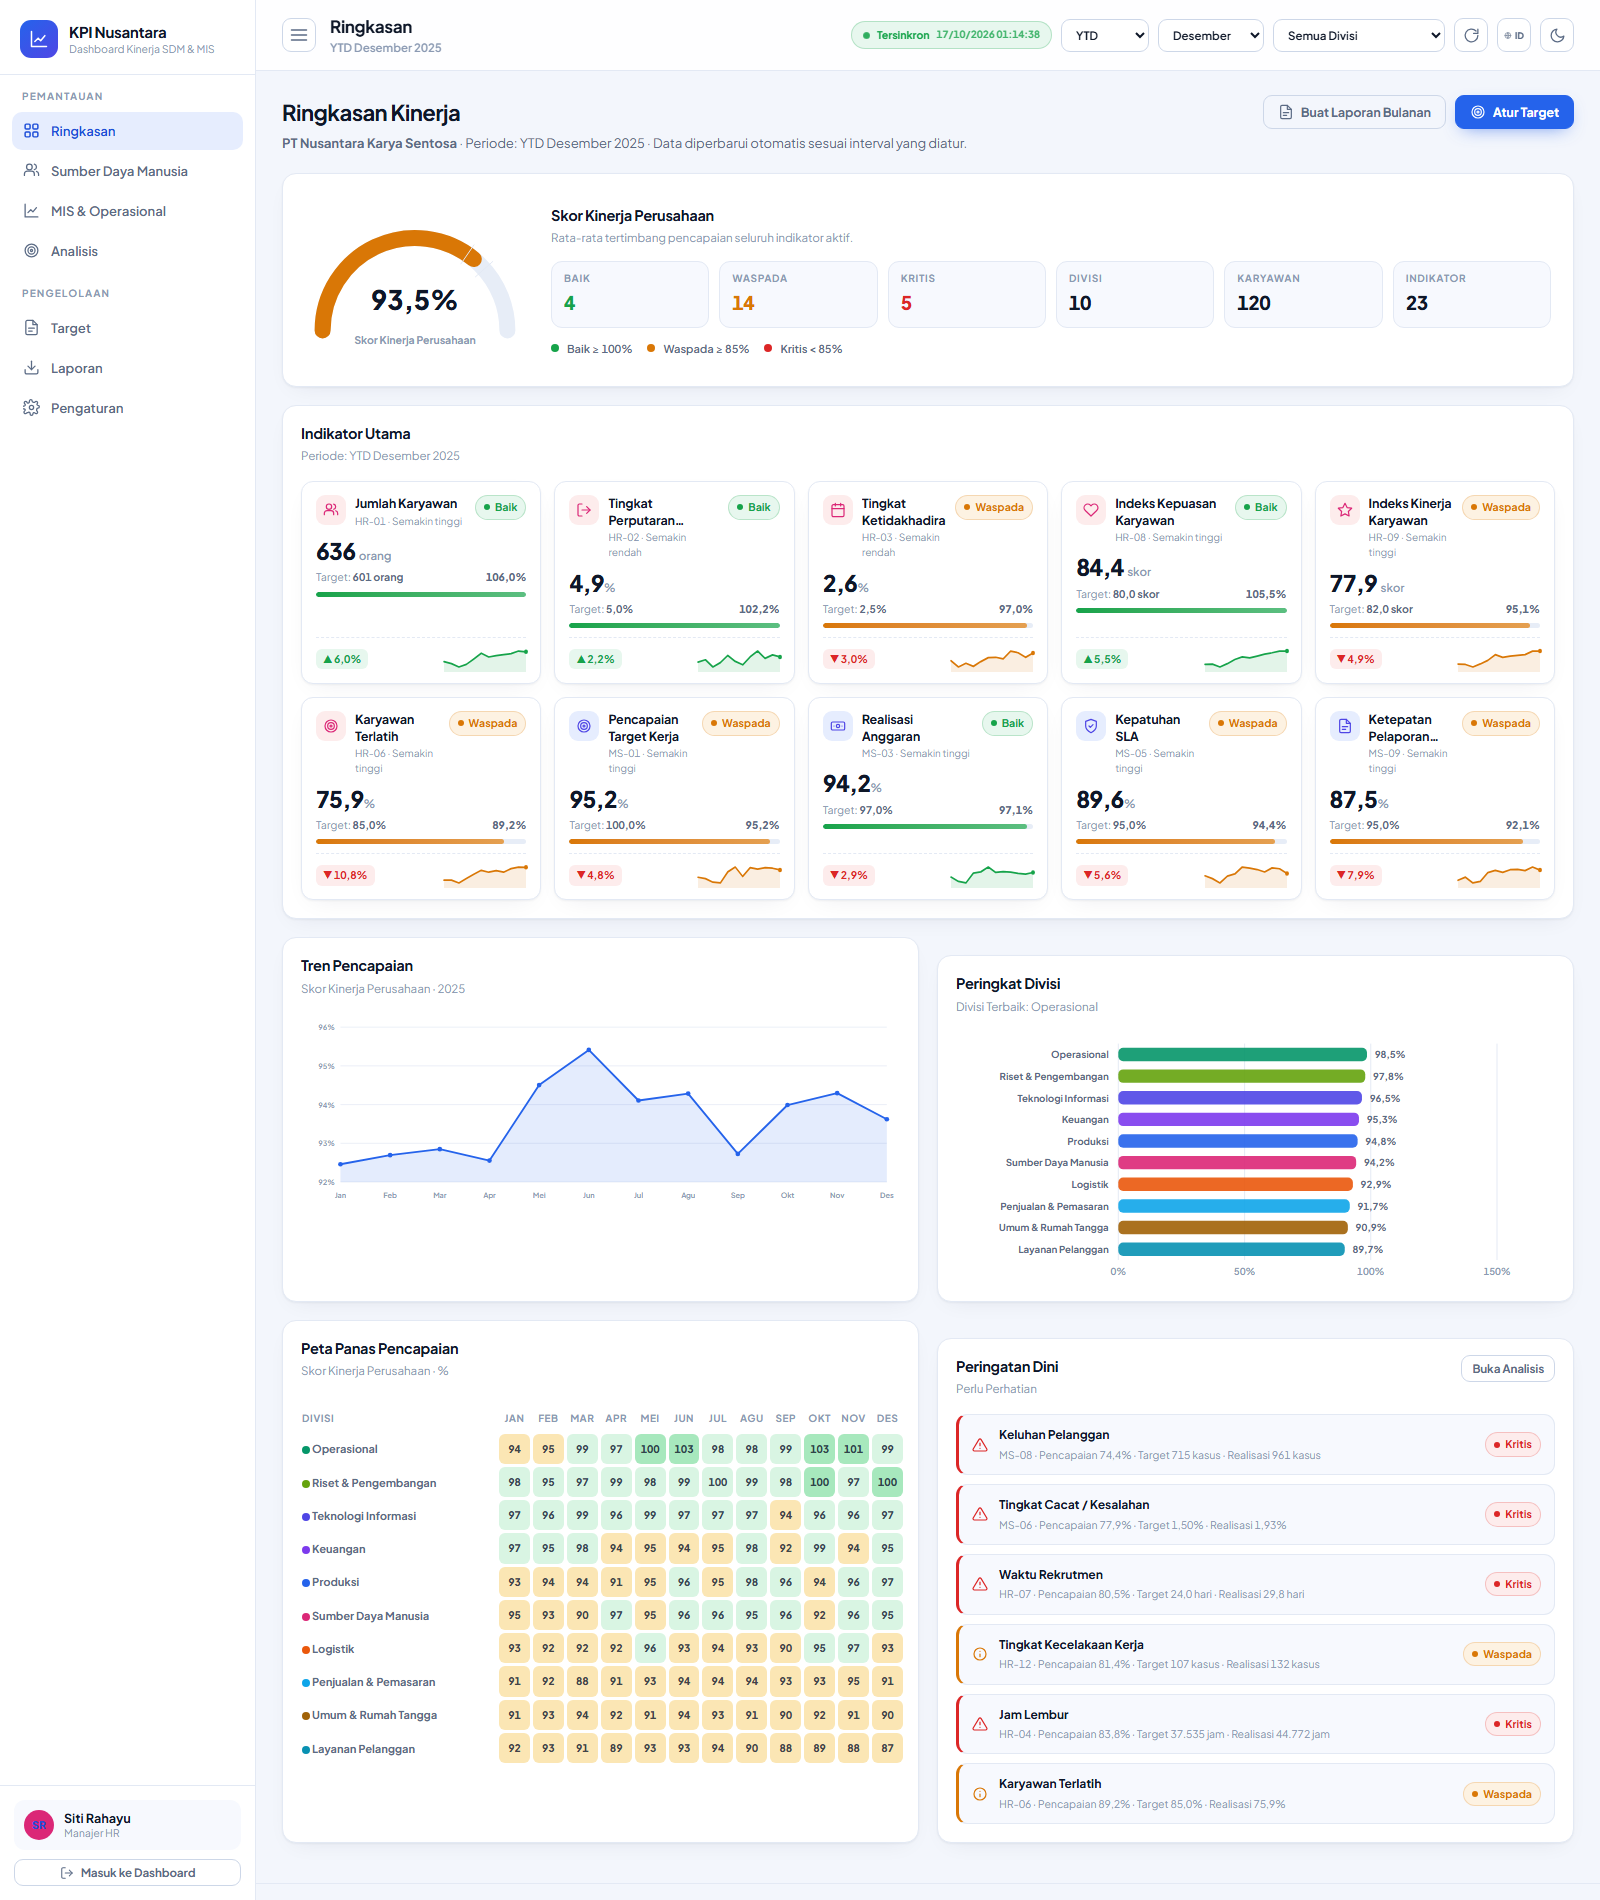
An indicator is a model, not a cell: code, unit, direction, aggregation, weight, annual target, monthly breakdown, thresholds and status. Turnover and defect rate improve when they go down, productivity and SLA when they go up: both directions are normalised into one achievement percentage, so ranking, heatmap and composite score treat them the same way. Ten divisions roll up to one company score: sum for flows, average for levels, weighted by headcount for rates.
The screens
Overview with a composite gauge, KPI cards, a trend across 12 months, division ranking, an achievement heatmap and a list of early warnings. HR with 12 indicators in four groups and an employee roster. MIS with 11 indicators and a matrix of divisions and indicators. Analysis with projection, comparison and largest deviations. Plus targets, reports and settings.
The targets
Entered once a year, then spread across twelve months on the Indonesian business calendar: Lebaran, the mid year push, the closing of the year. Every month stays editable with a live sum check for flows and an average check for rates, and every change lands in a revision log.
The recap
A closed month becomes a real Excel, PDF or CSV file. A schedule sends it to email and WhatsApp recipients on the fifth at 08:00, and archives a checksummed copy. The dispatch log keeps the failures too.
Four views by role, all from one dataset. Vanilla HTML, CSS and JavaScript with SVG charts drawn by hand: no build step, no chart library. 57 automated assertions.
Live: https://kpi-nusantara.pages.dev
What did it come to?
23indicators across HR and MIS