One sales model, nine measures, one source of truth.
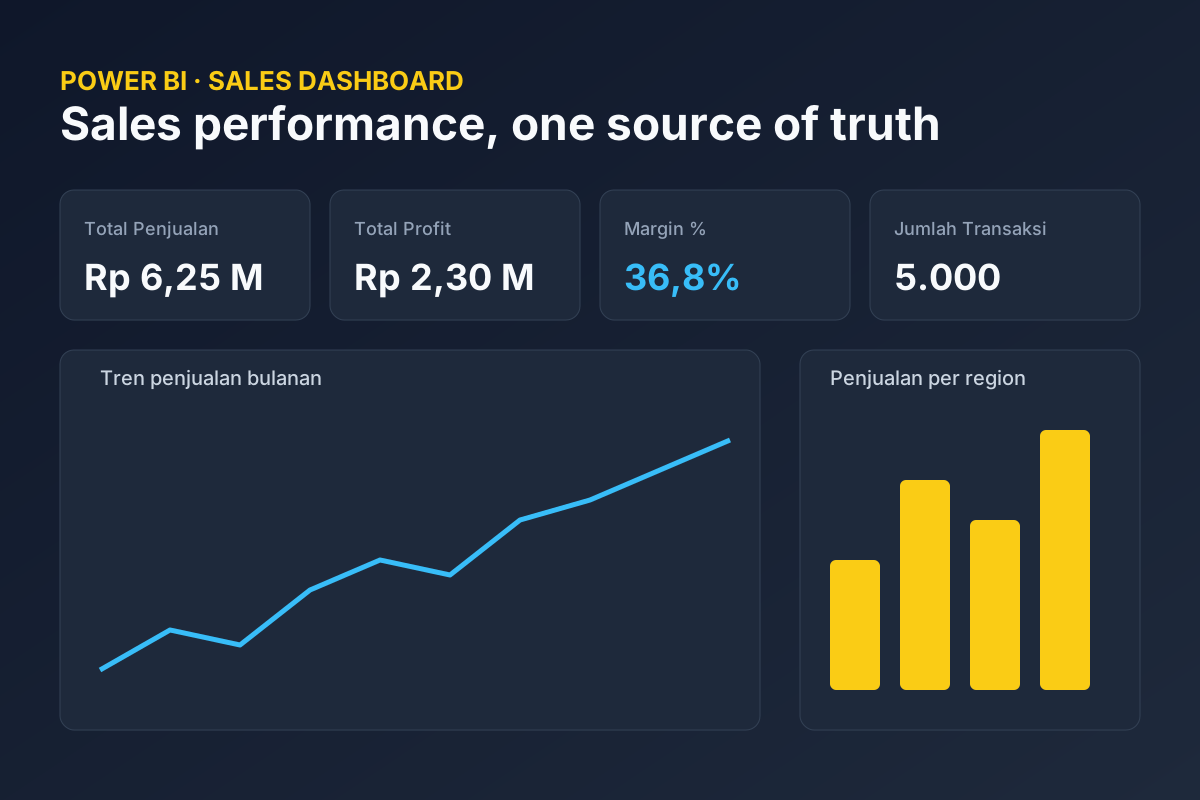
5,000 transactions from January 2023 to December 2024, behind nine DAX measures.
What does the work involve?
Portfolio case study. All data is fictional and simulated.
Problem
Sales reporting usually lives in scattered spreadsheets. Each region sends its own file, totals are rebuilt by hand, and management asks the same questions every month: how are we doing, which region is slipping, and which product line makes the margin.
Approach
I modelled the data as a proper semantic model in Power BI instead of one large sheet. A Sales fact table (5,000 transactions, January 2023 to December 2024) is linked to a generated Calendar table, so every question about time uses the same date logic. Business definitions live in nine DAX measures: sales, cost of goods, profit, margin, transaction count, average per transaction, same period last year, and growth against it. The visuals do not recalculate anything themselves.
The dashboard
One page, readable in ten seconds: four KPI cards (sales, profit, margin, transactions), a year slicer, a monthly sales trend, and two column charts: sales by region and profit by product category.
The project files
The data source path is set once in a parameter, so the same model can point at a real export. The project is saved as PBIP, a text format that works with Git, and includes a Node script that regenerates the sample data.
What it shows
The point is not the charts. Every number on the page comes from one definition, and changing a definition means changing one measure.
What did it come to?
5,000transactions modelled from one fact table