One KPI model for HR and MIS.
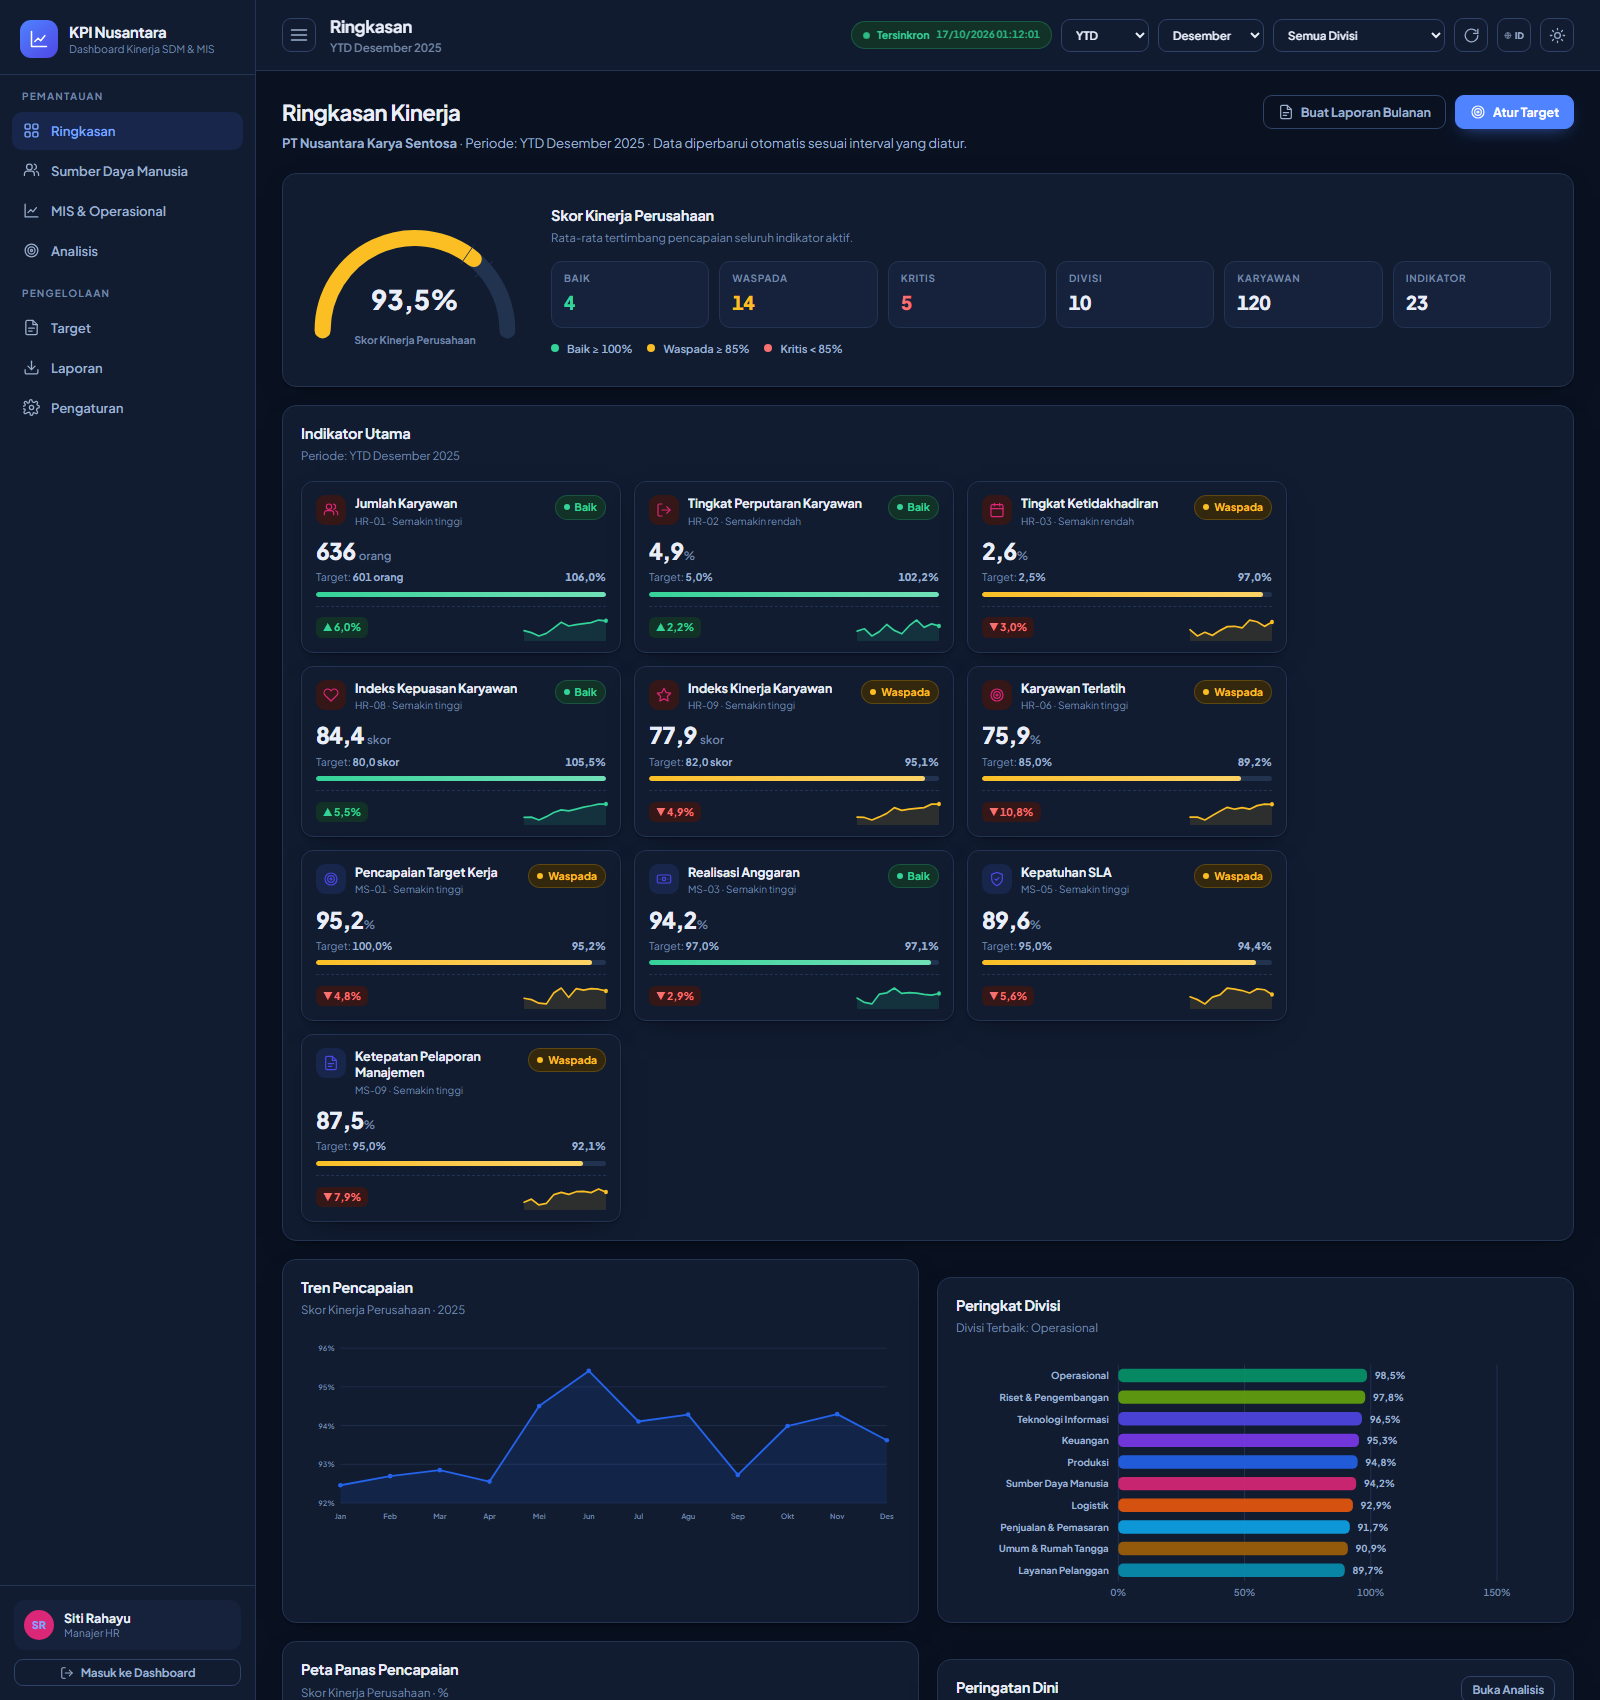
23 indicators across 10 divisions and four views by role, from one dataset.
What does the work involve?
Portfolio case study. All data is fictional and simulated.
Problem. HR reports turnover and training hours. MIS reports SLA and budget. Management receives two decks that disagree about the same month, and someone rebuilds the monthly recap by hand every single time.
Approach. I treated an indicator as a model, not a cell. Definition, unit, direction, annual target, monthly breakdown, thresholds and status live in one engine, and both directions are normalised into one achievement percentage, so ranking, heatmap and composite score compare them the same way. Targets are entered annually and spread across twelve months on the Indonesian business calendar, with a live sum check so a target that does not add up is never saved. The thresholds that decide good, warning and critical are editable by HR and by division heads: no developer required.
Result. 23 indicators across 10 divisions and four views based on role, all from one dataset: a division head sees only their own division, the director sees one company score. The monthly recap generates in Excel or PDF, goes out to email and WhatsApp on a schedule, and archives itself with a checksum: the part that used to take an afternoon now takes a click. Built as a static web app with SVG charts drawn by hand and 57 automated assertions.
What did it come to?
23indicators in one shared model